

Interview Andy Shields on the impact of COVID-19 on the used vehicle market
Premise
A leading European leasing company was restructuring its funding lines and made a presentation to the potential bankers. Within this presentation was a chart titled “Used car values – more secure than gold”. It detailed used car values from 1950 through to the present day; these were compared to the price of gold. What was amazing was the stability of used car prices, relative to the value of gold. That was up to the 2008/9 financial crash; at that point used car values plummeted for a year and a half, only rebound back within the same time frame. This, the Finance Director said, was a one-off freak event and the 3 year “wobble” had even proved the case for resilience of used car values over the long term. Used cars were, he concluded, a safe bet and well worth investing in.
What he failed to mention was the pain that many automotive businesses have suffered with used vehicle price volatility even in the “good times”. Many dealers and large fleets have been caught holding the wrong stock or being exposed to the trials of an individual Manufacturer’s (OEM) self-inflicted price volatility.
Indeed, during the 2008/9 financial crisis, dealers, leasing companies, rental companies and OEM banks (Finance Houses) were hit hard by the intensity of the drop and needed to react with robust measures to mitigate the problems. The stark choice, “your first loss is your best loss” vs “run the vehicles on, it will recover” is a challenge many face, again and again. Over the financial crisis, used prices were truly under pressure, with drops of over 20% through the period common place.
Looking at January and February this year across Europe, the used vehicle market started in good health. But, as we move into the realms of COVID-19, with global stock markets highly volatile, Italy, France Spain and others in lockdown (with further countries ramping up their response), many questions need to be asked:
- Will there be an RV crash of the same proportions as in 2008/9?
- How do you keep a close view on market movements in a daily changing environment?
- What are the mitigating factors that dealers and fleet owners can implement to manage the issues and protect themselves from the worst of the problems?
The early signals - How is COVID-19 impacting the used vehicle market
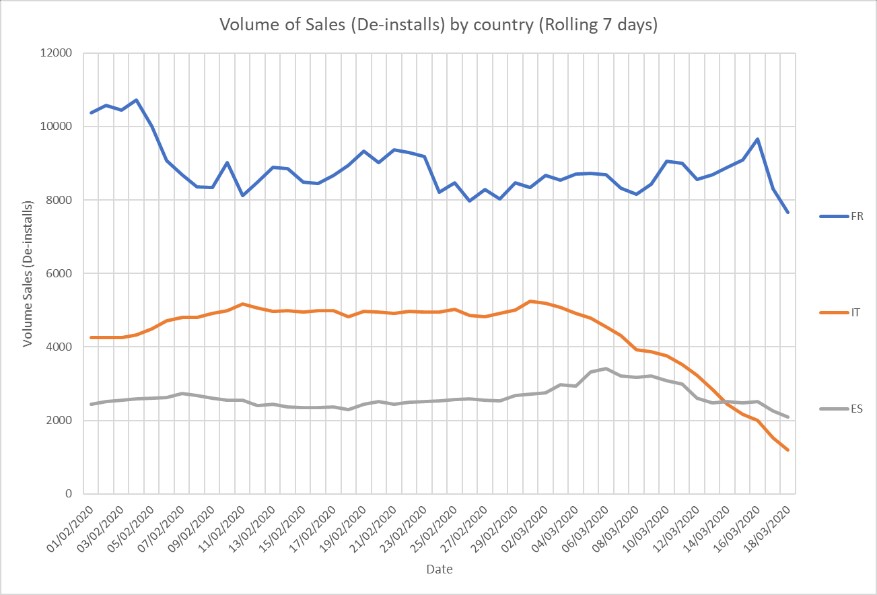
Indicata analyses the internet for 9m vehicle advertisements across Europe every day. Getting a strong view of demand and retail market pricing gives the earliest warning of the issues or opportunities to come. By analysing the number of vehicle adverts removed from the internet (de-installs), Indicata can generate an assessment of B2C of used vehicle market activity1.
The Fig.1 shows the sales rate of Italy vs France and Spain. The dramatic drop off In Italy is clear. Spain’s volumes are beginning to ease, and the shock restrictions implemented by Macron on the second week of March are also evident.
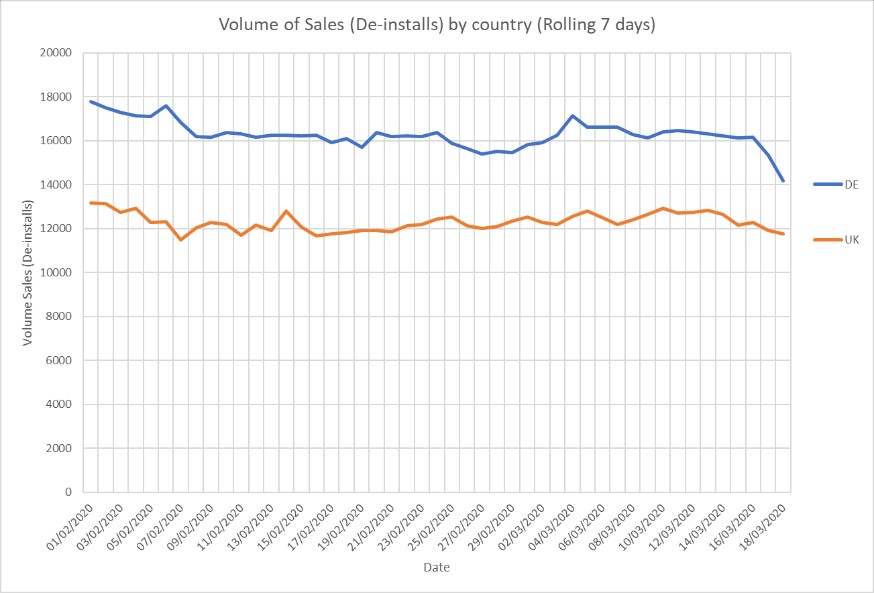
Comparing UK and Germany (Fig.2) we can see that whilst UK is only showing a small reduction, there is a recent step change in Germany’s trajectory
The next grouping (Fig 3) illustrates the variances between medium sized countries. The Netherlands and Sweden already have some impact, but Poland and Turkey are yet to see any impact.
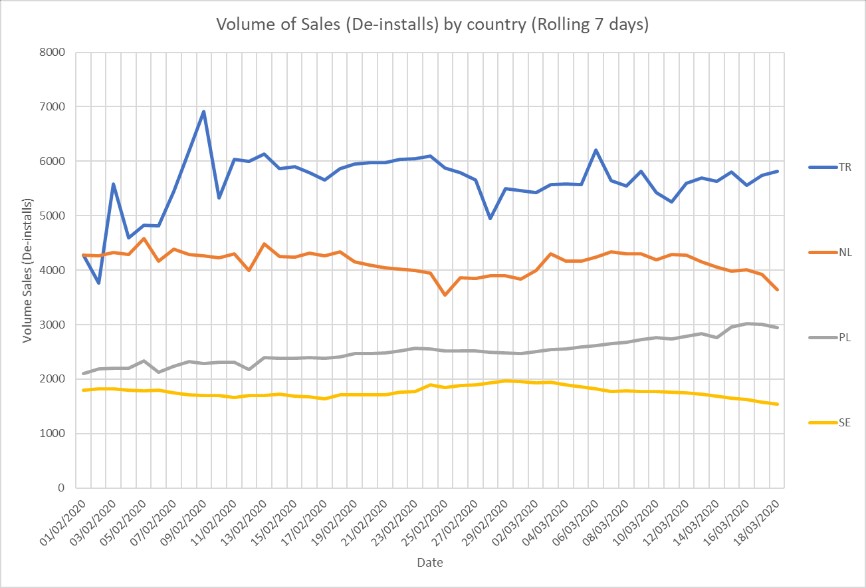
Turkey and Poland also have some of the lowest infection rates (See later).
Finally looking at Europe’s smaller countries (Fig.4), again there is a marked differential between markets. Austria closed border with Italy on the 11 March and implemented further restrictions daily thereafter. The effect has been instant. Denmark and Belgium too have had to implement strong sanctions and the effects are showing. Portugal on the 11 March (when Austria was closing borders) only had 61 cases. In 10 days, this broke through 1000 with the government declaring a state of emergency on the 19 March. Expect sales rates to drop quickly.
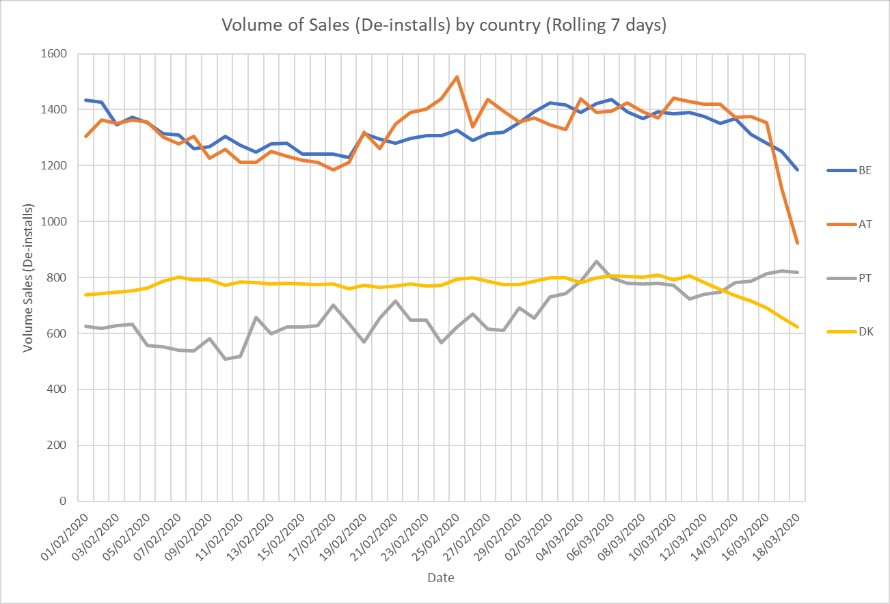
Fig. 5 shows the correlation between Infection Rates and the drop off in the used vehicle market. Here we have looked at the last 7 days to March18 vs. the average 7 day run rate in February. We have then compared to Infection Rates per 1 million of population.
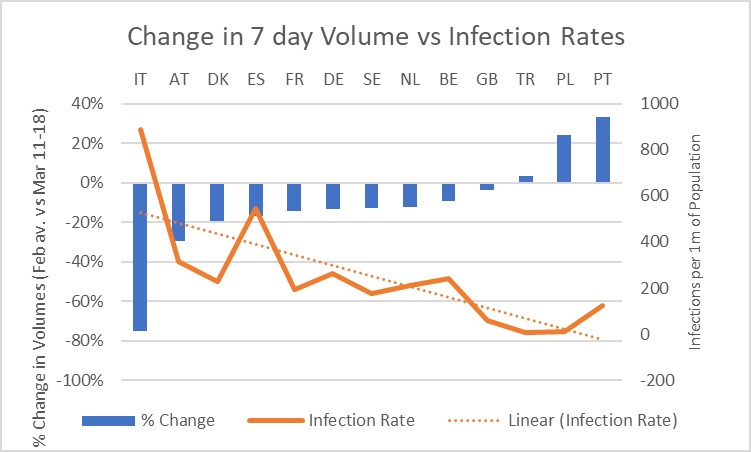
Those countries like Portugal, Poland and Turkey, with low infection rates have been the least affected, indeed still growing. As infection rates now grow, the impact on their industry will clearly increase. Equally, the data suggests that as infection rates vary over the progress of disease progresses thus so will market impacts. For a remarketer in the current environment, knowing the country by country market trends and differentials will be vital to finding effective sales channels. Going forward, INDICATA Market Watch will provide regular updates showing (with daily granularity) of not just sales volumes, but dealer purchases and market pricing for its customers. This data will be available by market, manufacturer, model, vehicle age segment etc)
Prognosis for used vehicle market over the next year
Recent strong used vehicle values across Europe have been driven by strong demand, as the continent finally shed the years of economic and political turmoil post the 2008/9 crash. Even in countries where new volumes have recently dropped, the lack of used vehicle supply has sustained used vehicle values. But, as Europe enters the challenges of COVID-19, with consumers facing economic insecurity, how will this now impact on used vehicle demand? Across Europe, recent new vehicle volumes now mean that major leasing companies and OEM banks have strong pipelines of used vehicle stocks needing to be disposed of over the next few years.
To get an understanding of the used vehicle market going forward, firstly we need to overlay our best assumptions about how the wider spread of the disease will develop, and then make assumptions on how that will affect the market and over what time period.
Progression of the disease
Most European countries are following the staged approach laid down by the European Centre for Disease Control. This approach can be summarised as follows:
Phase 1 – Containment; Identify any infected persons, isolate. Test and isolate known contacts.
Phase 2 – Slow down/ delay; Introduce measures of social distancing to slow the spread thus allowing health services to manage large volumes of cases without being overrun.
Phase 3 – Mitigation; Peak level actions to minimise the adverse effect on the community.
Initially, most government strategies have been aimed to minimise the peak, but ensuring it holds to summer months when health services will be most able to cope with the increased demand.
Figure 6 is an extract from the UK medical journal The Lancet detailing how the strength of the various delay factors affects peak infection.
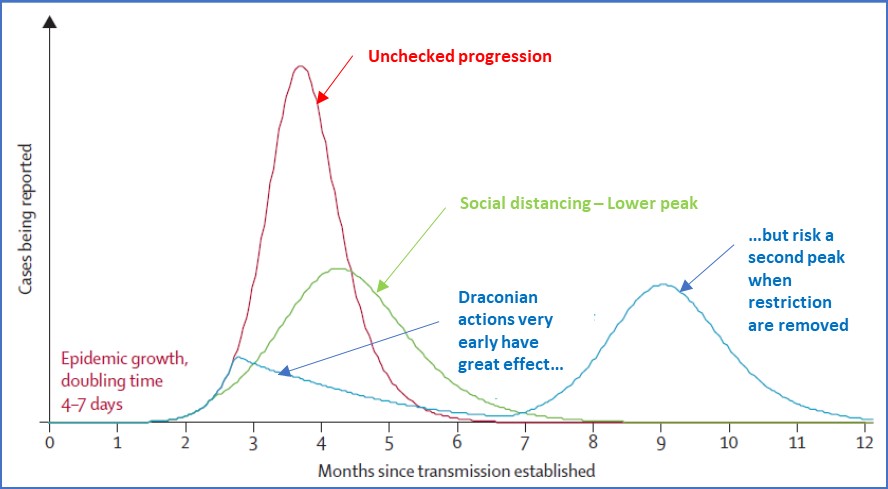
Source: The Lancet
Currently, each government is implementing its measures independently according to the rates of infection. Italy went into lockdown first since it had infection rates well above other countries. As we have seen, the strength and timing of the controls implemented (and their impacts) varies between countries. All countries will have to raise the level of controls as infection rate rise.
How hard and how long will Social Distancing measures last?
There are signals however, that these Mitigation actions may not be enough. Indeed the UK government’ chief scientific advisor initially stated that there is a need for “herd immunity” i.e. 60%+ of the population need to get infected by COVID-19 to minimise the risk of repeat out breaks [before winter months, when the UK health service our be further pressurised by other seasonal medical demands].
Recent analysis and models have shown that this will not be sufficient, and that the UK will now have to follow a policy of Suppression, implementing far stronger Social Distancing controls to lower the peak AND thus extend the period beyond the summer, potentially 12-18 months. The implementation of social distancing measures (like China’s) is becoming ever stronger, with lockdowns resulting in home working, restriction on movement, cessation of all mass gatherings, and the closure of all cafes, restaurants and shops (including dealerships).
From a used vehicle perspective this is causing a halt to trading along with many other industry segments in the effected countries. Dealerships closed, logistics curtailed even simple tasks of processing documents halted. If this continues for an extended period, the long-term damage done to all sectors and economies (not just the motor industry) will be significant. Governments cannot shut entire countries down for extended periods without consequences.
So, are there signs that social distancing measures work and that these restrictions could be eased to allow economic activity to continue? China first notified the WHO of an unknown virus on 31 December, shutting down the Huanan Seafood Wholesale market on the 1st January. On the 23rd January, Wuhan went into lockdown with 14 other cities a day later.
Figure 7 shows the impact of this on the infection rate in China. From start of the (draconian) social controls to the reduction in infection rates took approximately 4 weeks.
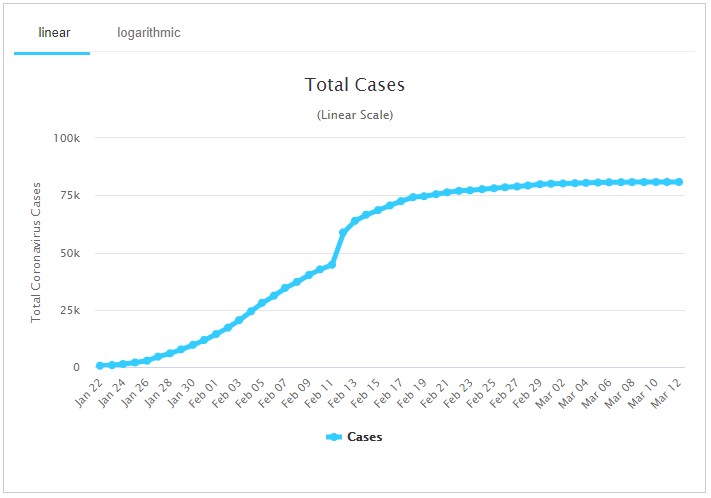
Source: Worldometer
China looks like it is getting infection rates under control and indeed has started (21 March) now to relax its measures. The planning is in-place as China balances controls on infection rates with the need to re-stimulate production and consumer demand. However, China needs not to balance its strategies to not create a second escalation as illustrated in Figure 6. Thus, it is assumed that whilst initial government actions result in the closure of all retail outlets (including dealers) leading to a sudden shock, the easing of measures will (and must) come as governments balance impact on economies with the progression of infection.
Ongoing economic impact (following easing in initial restrictions)
Our working assumption for the progression of government action and infection rates is as follows:
- Initial growth during the “Contain” phase (this stage is over in most countries)
- Very strong (but non-sustainable) Social Distancing controls.
- China reduced transmission rates in a matter of 4 weeks, but this may be double (or more) in EU countries
- Easing of controls but still enough to flatten Peak Virus
- Balancing the economy against infection levels
- A phasing out of controls into 2021.
To assess how the world may look following the easing of restrictions we can look at the prior two economic crashes. It is clear that the stock markets are reacting very badly. However, stock markets and economies have always been cyclical. Looking at the FTEuroFirst300 (Fig.8), the level of drops incurred between on the 2000 crash and the 2007 crash have been broadly similar.
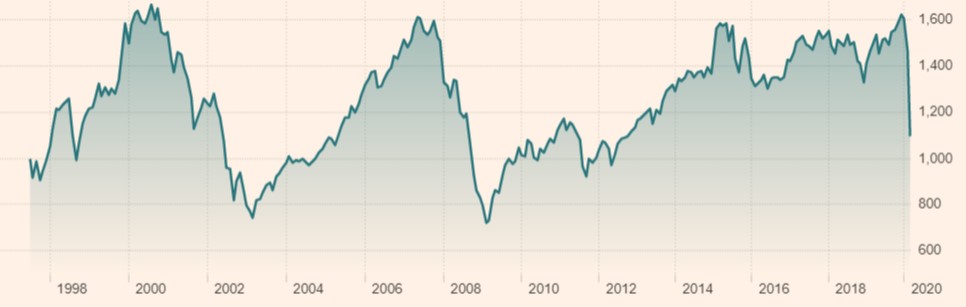
Source: Financial Times
If we look at the impact on GDP (Fig.9) there is a marked difference between the two crashes.
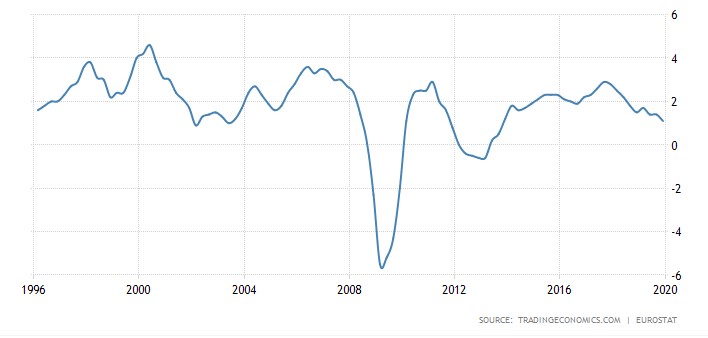
Source: Tradingeconomics.com | Eurostat
Comparing the 2 events, GDP remained relatively stable in 2000-2002. It was the bursting of a tech bubble that went caused stock market’s issues, rather than fundamental underlying economic problem. In 2008/9 GDP crashed as the fundamentals of the economy were materially damaged by the underlying issues with the banking sector and unregulated debt. Thus, whilst the stock market may crash, the key factor is the underlying resilience of the economy.
There are thus 3 possible scenarios we can consider:
- BEST CASE: There will be a severe short-term hit to the market over a 6-9 month period. However, the underlying resilience of the economy coupled with government stimulation will mean a quick recovery.
- MEDIUM CASE: The short-term hit will then be followed by a longer period of flat or slow recovery as material damage will have been done to the underlying economy. Consumer confidence and buying power will be deeply impacted. There will be no quick recovery due to pent up demand. The depth of this post hit period may be of the same order as the last financial crisis (albeit timeframes may be extended)
- WORST CASE: The economy will be significantly damaged in the period of peak virus. This damage will be greater than the last crisis with several European countries requiring significant bailouts. Global Economy will take many years to return to pre-crash levels.
Predicting these outcomes is extremely hard. For the purposes of this document we will assume the Medium Case is the most likely scenario, but it remains very early stages. The size of government fiscal and monetary policies to alleviate announced by several countries shows how challenging limiting impact to this Medium Case may be.
Unlike 2008/9, there will be an initial deep drop off in used vehicle volumes as tough social distancing measures are implemented. To assess what happens to volumes thereafter in a Medium Case, we may get insight by reviewing what happened in the last financial crisis.
Figure 10 shows the impact on used volumes by country 2007-2013
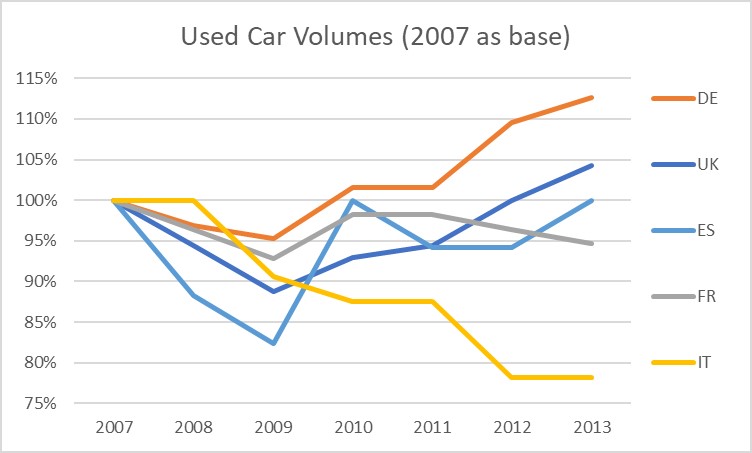
Source: Country Associations
For most countries the worst point occurred in 2009. However, it took 2 years from peak in 2007 to trough in 2009. Germany then recovered to pre-crash levels within one year, whilst UK took 3 years and Spain 4 years. Italy, hit by further sovereign debt issues, continued to decay. It is noteworthy that the used car market proved significantly more resilient than the new car market (Figure 11)
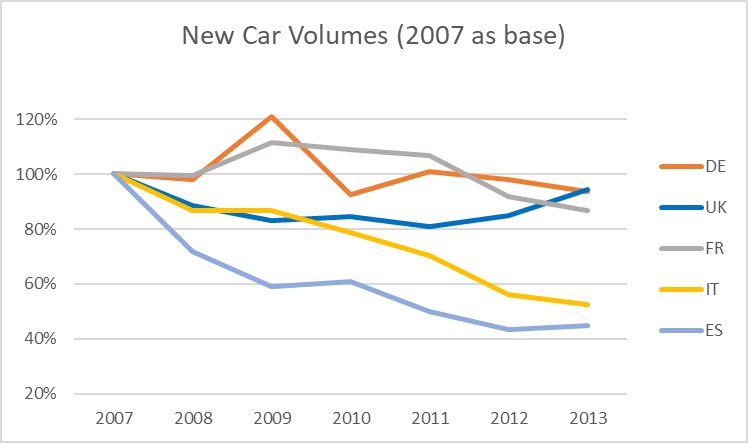
Source: Country Associations
No countries’ new car market returned to its original level by 2013. Whilst Spain’s used market recovered, its new car market crashed to 43% of 2007 levels. Italy’s used car markets dropped to 78% of the 2007 levels, its new market was hit even harder and dropped to 52% of historical levels.
Figure 12 shows the stark comparison between the new and used car markets
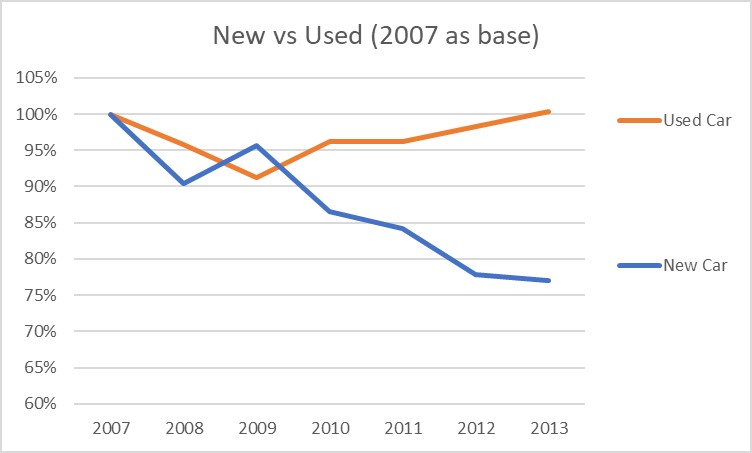
Source: Country Associations
So why such a difference between new and used car markets? There are two drivers to this:
- The New vehicle market is more demand side driven:
Whilst OEM’s are often criticised for pushing excess volumes onto the market, there is truly a limit to the effectiveness of this. In a marked market downturn, the level of financial support and discounting that an OEM can give is limited. At a point, sales are economically unviable, so factories are slowed, or production suspended.
- The Used vehicle market is more supply side driven:
Fleets cannot stop the selling of used vehicles (particularly in a downturn). Whilst run-on strategies may happen, the economics of vehicle fleets mean that defleets cannot stop 100%. Indeed, as leasing and rental companies’ customer demand shrinks, more units are forced to market. The changing nature of consumer finance also has an impact. In pressure times, consumers either default on loans or, driven by stronger consumer credit legislation, have greater opportunity to exit finance agreements and return vehicles with minimal penalties.
Both these factors provide a supply stimulus to the market. Unlike OEM’s new vehicle pricing, used vehicles prices are a more flexible commodity. Big fleets cannot store vehicles until the market returns, in the same way OEM’s can suspend production. Defaulting consumers do not care about the losses the Finance provider incurs after the early termination of a loan.
Summary
As stated, this document plans for the for the MEDIUM CASE scenario to play out. As such:
- Social distancing controls will have a material and immediate negative impact on used vehicle volumes. The timing of the initial hit will vary country by country (albeit only by a matter of weeks)
- As infection rates are controlled, social distancing will be eased, but consumer confidence and buying power will be damaged. Infections (and controls) continue over 2020 and into 2021
- Financial easing by governments will prevent a complete implosion of economies, but will not prevent material impact (GDP reductions) over a longer timeframe that the last recession
- Driven by supply side push, used vehicle volumes will prove to me more resilient than new vehicle volumes, but still face negative pressures
- Whilst in 2008/9 there was a steep decline in used vehicle prices followed by a bounce, we should automatically expect this to be repeated. Prices risk being under pressure for a sustained period of time (up to 2-4 years).
- Even into 2021 and beyond, volatility will be high, and the impact and severity by country will be highly varied also
What would influence a BEST-CASE scenario happening?
To move to a best-case scenario, several factors would have to play out.
- Initial infection rates can be controlled quickly by social distancing measures which can be materially eased in a few weeks
- Upper level total infection rates (80% of population) quoted by political leaders including Angela Merkel and Boris Johnson prove to be wide of the mark
- Medical advances minimise hospitalisation and death rates compared to the current Italian experiences with a vaccine available before year end
- Consumer confidence in the near term returns quickly, despite the initial shock disruption to people’s daily lives
What would influence a WORST CASE scenario happening?
- Governments elect to implement strong Social Distancing measures for an extended period (4-8 months)
- After easing its controls, China’s exponential infection rate resumes. China’s Economy falls closer to zero growth (or contraction). Global supply chains remain starved of Chinese goods
- Immediate economic impact of the virus inflicts material harm on one or more EU Economies causing a repeat of the Sovereign debt issues on Greece, Italy and Spain. Germany is not willing (or able) to bail out Europe
At time of whiting it appears that the likelihood of slipping to a worst-case scenario is greater than the probability of a best-case scenario. However, at this stage we will remain with the Medium Case assumption.
Sector Impacts and contingency actions
Rental companies
For rental re-marketing, if there was to be a better time for a major disturbance, this is it. Had the virus started mid-year, with rental companies at peak leisure market, the price impact of mass defleets and dropping on-rents would have been painful. Not that this environment is easy. Rental companies will have contracted the majority of their annual volumes with OEM’s by now so will need to re-assess current contracts based on 3 key factors: volume flexibility, holding period flexibility and certainty of Residual Value (RV) certainty (i.e. buyback). In many cases contracts will be defaulted on, such is the loss of demand in the rental industry. This will leave OEM’s with both a gap in new sales and stock of unregistered (and in some cases registered ready for delivery) new vehicles the rental industry does not want.
In addition, defleets will be happening now as rental demand drops. Initially these will be focussed at OEM buybacks. Rental companies will try and hold risk vehicles until after the initial Social Distancing but whilst run on actions can help a rental company to overcome initial supply / demand imbalances, that rarely works in a sustained downturn. The first hit is the best hit. However, there is and will be significant volatility on demand and significant differences between country markets capacity to absorb stock at any one time.
Thus, EU rental company remarketing operation should be flexible in which countries they remarket vehicles in. This requires four capabilities:
- The ability to open new markets quickly (even though there may be no existing remarketing or logistics infrastructure)
- The ability to quickly expand buyer-base locally and find new channels to market
- The ability to remarket in multiple countries simultaneously
- The ability to identify what is happening in markets both in terms of sales rates and terms of live pricing data
Leasing Companies
The challenge for the leasing industry will be to manage the current volatility in the market whilst respecting the fact that there may be no short-term recovery in RV’s. In 2008/9 many leasing companies extended contract and ran on vehicles. With the risk that used vehicle prices are suppressed for an extended period of time, an immediate run on vehicles may not be ideal. Even so, vehicles will still need to be remarketed over the downturn. With countries implementing and easing restrictions at differing times, logistical flexibility coupled with sound market data to identify the real time opportunities will be key.
Remarketers and fleet planners will need the ability to:
- Identify the changing fortunes of country markets or segments
- Monitor of the retail market dynamics that will quickly cascade into trade market opportunities.
- Quickly expand channels and countries of re-marketing
OEM’s and OEM Banks
OEM’s and OEM banks face different challenges, but they must face these together in order to be successful. Initially hit with larger than expected volumes of rental defleets and even holding 0Km vehicles that were destined for the rental industry, a decision to quickly exit vehicles before social distancing measure take hold on a widespread basis will require bold actions. It may be worth it in the long term as RV pressures take hold.
Traditionally many OEM’s have (rightly) had a policy to only remarket vehicles generated in a market back into that market (focussing primarily on their franchised network). However, if used prices are going to drop, holding vehicles in country A (waiting for recovery) may be the wrong decision if County B (albeit weakened) is still operating as a liquid market. Monitoring cross border opportunities coupled with enacting new non-franchise targeted sales strategies may reduce immediate stock pressures and minimise losses.
OEM banks face two incremental pressures on their remarketing
- Increasing numbers of returns to the bank, exacerbated by
- Increased RV related funding (PCP or other RV dependent products)
- Increased consumer ability to return vehicles driven by stronger consumer laws and regulation
- Negative or minimal equity in end of contract vehicles (where risk defaults to the bank).
OEM banks need to identify new routes to market for increasing numbers of returned vehicles. Re-possessions, where vehicle history and maintenance are less well known, require re-marketing outside of the core franchised dealer network, yet finding these routes in a declining market will prove challenging. With RV underwritten products, OEM banks may find their exposure increasing. This dictates two courses of action:
- OEM’s and their banks should identify all agreements with either positive or near positive equity and targeted these customers to change vehicles quickly. Even with negative equity it may be worth encouraging a swap. This will generate a new vehicle sale and minimise the contingent RV risk.
- Where vehicles are returned to the OEM bank, new (potentially non-franchise) routes of disposal may be needed.
Dealers and Dealer Groups
Dealers will face significant challenges as their new vehicle volumes come under real pressure. Key to survival will be to strengthen and develop used vehicle operations as used volumes have weathered past financial storms better. In a hostile market, stock turn is the most powerful weapon for defending profitability.
Indicata’s consultancy work with Dealer groups shows the impact on Gross Profits as a result of holding vehicles too long (even in a good market). Figure 13 shows the Gross Profits from a study Indicata carried out on a 50-outlet dealer group.
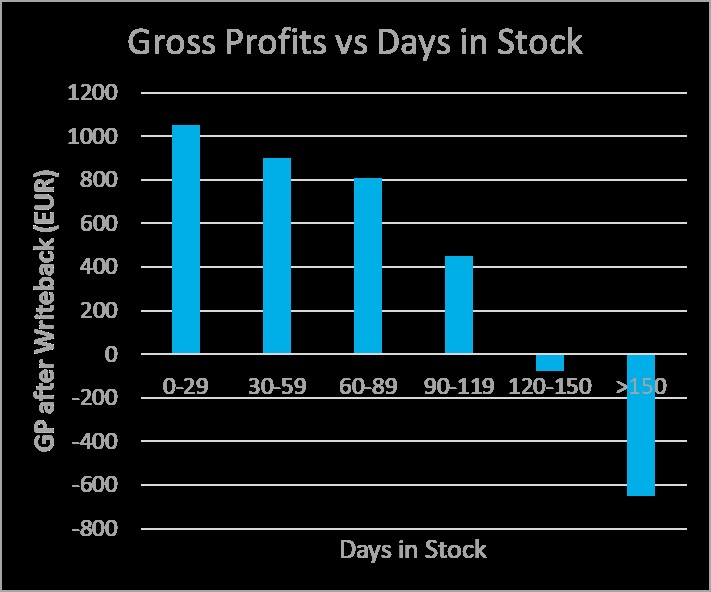
GP= Sale – Purchase - Refurbishment
This initial analysis clearly shows how holding vehicles too long deeply suppresses profitability. To counter this, the dealer group piloted Indicata’s pricing tools and strategies designed at maximising profits on fresh vehicles, whilst minimising. The stock turn moved from 4 to 8 times but still maintained a 3% price premium to the market. Gross Profits were doubled. The group subsequently implemented these practices on all branches. In a highly volatile market, developing market driven pricing strategies to control ageing vehicle levels will be the single most important strategy to used vehicle survival. In addition, sourcing (and trading) is key. Fully understanding the attractiveness of any piece of stock that is being sourced is vital.
Indicata also consulted with a Dutch dealer group, now using Market Days Supply (MDS) to assess vehicle attractiveness. MDS measures the recent market sale rate of a vehicle (make model trim etc) and then compares to the total stock of similar vehicles the market. Low MDS = a fast selling vehicle relative to levels of stock at competing dealers. By sourcing low MDS stock, the dealer sold 80% of stock in the 0-60 day (max profit) sweet spot, achieving 9x stock turns. Conversely, where staff sourced outside policy (>120 days MDS) 45% of vehicles became a material ageing problem and entering the loss-making zone. This also illustrates the importance of having daily operational control and reporting. It is one thing dictating used vehicle policy and pricing strategy, but to be effective it is vital that CEO’s have the reporting tools and controls to ensure that they are implemented.
Finally, in a COVID-19 world there will be a reduction of showroom traffic. Prospective customers new home-working under government restrictions will spend longer researching online. Sales Executives will have less and less opportunity to engage with them. Implementing video programmes (such as CitNow) to convert sales leads in to purchases without a showroom visit will be vital. However, generating effective web leads will be key to starting this sales process off.
Dealers implementing online trade-in valuation tools (in exchange for contact details) will materially increase web effectiveness. An average dealer website will generate 1% of web site visitors to leads (normally with a 40% conversion rate to sale). Implementing an online lead generator will double this rate of lead generation (with the incremental leads converting at c30% to sales). For a 10-outlet dealer group with typical monthly traffic of 25,000 web sessions, this would result in 250 incremental leads and 75 incremental sales.
About the author
Andrew Shields is the Global Business Unit Director of Indicata, part of the Autorola Group. Having started his career in an OEM, Andy joined Avis Europe plc becoming European Director of Fleet and Remarketing, co-ordinating a €3bn fleet business across 11 European countries. In addition, Andy has extensive retail experience as VP Sales and Supply for a used car supermarket operation. During the financial crisis 2008/9, sales at the supermarket grew from 300 sales per month to 1000 sales per month.Before joining Indicata, Andy ran his own Automotive consultancy. Projects included launching a new leasing company for VW Bank, dealer group used car profit improvement projects and developing remarketing and used car improvement programmes for European OEM’s.
Check the interview in which Andy Shields explains the white paper live; https://www.youtube.com/watch?v=68_MiuEboMo
1About Indicata Data in this report
Indicata analyses 9m Used Vehicle adverts across Europe every day. In order to ensure data integrity our system go through extensive data cleansing processes. The data in this report has been cleansed to maximise its usefulness for trend analysis and does not intend to be a representation of the total number of “Change of ownership” that may be reported in a country market. In some countries, official statistics become inflated as they count the sales of a vehicle multiple times (Sale from fleet to dealer and then dealer to consumer may count as 2 transactions). The Sales (deinstall data) in this report is based on advertisements of recognised automotive retailers of true used vehicles. As such, it does not include data related to private (P2P) advertisements.
The main Indicata toolset allows customers to analyse 0Km (Pre-registered) vehicles coupled with demonstrators and courtesy vehicles. To maintain the integrity of this data set for trend analysis of the true used vehicle market, these vehicles have been excluded from the data. The all Indicata data cleansed by a range of mechanisms, for example
- Indicata de-duplicates any vehicle that has been advertised on multiple sites. Where a vehicle provenance is not 100% certain to allow de-duplication, it is excluded from the statistics.
- Where dealers cycle stock on advertising portals, all efforts are made to eliminate these de-installs and re-installs by comparing to a back catalogue of stock held that dealer.
- Indicata needs to have maximum certainty on the vehicle description. This is achieved by not only analysing the main vehicle description in the advert but also verifying against the whole of advertisement’s text (Power outputs, doors, transmission, model years etc). This is then compared to the Indicata Model Catalogue based on European vehicle homologation and OEM data. Only when level of identification certainty is achieved is the vehicle allowed into the Indicata dataset
- Indicata has an extensive photographic library of all facelift model year changes. For vehicles registered around to a model year change, Indicata uses AI photo recognition techniques to ensure that exact model descriptions are valid.
The 7-day sales rate is calculated by taking the average of the daily de-installs for the 7-day period on and prior to the reported date.
CONTACT
Click for free download https://www.indicata.nl/corona and you will receive an e-mail with your copy.
Bobby Rietveld, Sales Director INDICATA the Netherlands, Dit e-mailadres wordt beveiligd tegen spambots. JavaScript dient ingeschakeld te zijn om het te bekijken., mobile +31 (0)6 113 091 58
Frank Tanke, Country Manager the Netherlands, Dit e-mailadres wordt beveiligd tegen spambots. JavaScript dient ingeschakeld te zijn om het te bekijken., mobile +31 (0)6 868 152 50
Websites
INDICATA indicata.nl
Autorola nl.autorolagroup.com